Simulating hand-drawn elements topic on StackExchange
Writing a graphic element using TikZ and PGF:
\documentclass{article}
\usepackage{tikz}
\usetikzlibrary{arrows.meta} %to get different arrow tips
%%%<
\usepackage{verbatim}
\usepackage[active,tightpage]{preview}
\PreviewEnvironment{tikzpicture}
\setlength\PreviewBorder{5pt}%
%%%>
\begin{comment}
:Title: LearningTikz
:Tags: examples
:Author: Me
:Slug: Tutorials
Following CreÌmer_MinimalTikz_2011.pdf
Note default units are centimetres - scale command overrides for output.
Alternatively go to the command line window and type texdoc pgf and choose pgfmanual.pdf if needed from list if it appears.
\end{comment}
\usetikzlibrary{positioning}
\begin{document}
\begin{tikzpicture}[scale=1]
%\begin{tikzpicture}[xscale=2.5,yscale=0.5] % alternate scaling options.
\draw[help lines] (0,0) grid (2,3);
\draw (0,0) -- (1,2) -- (2,3) -- (1,0);
\draw (0,3) -- (1.5, 0.5);
%axes decorations
\draw [<->] (0,3) -- (0,0) -- (2,0);
%decorations on line ends
%can also use thickness commands
%ultra thin, very thin, thin, semithick, thick, very thick and ultra thick
%and [help lines] to highlight special points
%and [line width= 0.2cm] or [line width= 12] for pt or point widths
%and [dashed], or dotted
%and colours like [red] etc.
\draw [->, ultra thick, red] (0, -0.1) -- (2, -0.1);
\draw [ultra thin, dotted, <-] (0, -0.2) -- (2, -0.2);
\draw [|->, dashed] (0, -0.3) -- (2, -0.3);
\draw [yellow, line width=6] (0,0) -- (.5,0);
\end{tikzpicture}
\begin{tikzpicture}
\draw [yellow, line width=6] (0,0) -- (.5,0);
\draw [blue] (0.1,0.1) rectangle (1.6,1.1);
\draw [red, ultra thick] (2.2,0.6) circle [radius=0.5];;
\draw [gray] (4,0.1) arc [radius=1, start angle=45, end angle= 120];
\draw [<->, rounded corners, thick, purple] (0,2) -- (0,0) -- (3,0);
\end{tikzpicture}
\begin{tikzpicture}[xscale=1,yscale=1]
\draw [help lines] (0.6,1.34) -- (0.6,1) -- (1.05,1);
\draw[help lines] (0,0) grid (2,2);
\draw[orange] (0.6, 1.0385) --
(0.61, 1.06372) -- (0.62, 1.08756) -- (0.63, 1.11012) -- (0.64,
1.13147) -- (0.65, 1.15166) -- (0.66, 1.17074) -- (0.67, 1.18874) -- (0.68,
1.20568) -- (0.69, 1.22157) -- (0.7, 1.23643) -- (0.71, 1.25026) -- (0.72,
1.26307) -- (0.73, 1.27486) -- (0.74, 1.28561) -- (0.75, 1.29534) -- (0.76,
1.30402) -- (0.77, 1.31165) -- (0.78, 1.31821) -- (0.79, 1.32369) -- (0.8,
1.32806) -- (0.81, 1.33131) -- (0.82, 1.3334) -- (0.83, 1.33431) -- (0.84,
1.334) -- (0.85, 1.33244) -- (0.86, 1.32956) -- (0.87, 1.32533) -- (0.88,
1.31966) -- (0.89, 1.3125) -- (0.9, 1.30373) -- (0.91, 1.29325) -- (0.92,
1.2809) -- (0.93, 1.26649) -- (0.94, 1.24976) -- (0.95, 1.23032) -- (0.96,
1.2076) -- (0.97, 1.18065) -- (0.98, 1.14763) -- (0.99, 1.1038) -- (0.991,
1.09836) -- (0.992, 1.09261) -- (0.993, 1.0865) -- (0.994, 1.07994) -- (0.995,
1.07282) -- (0.996, 1.06497) -- (0.997, 1.0561) -- (0.998, 1.04563) -- (0.999,
1.03209) -- (0.9991, 1.03042) -- (0.9992, 1.02866) -- (0.9993,
1.02679) -- (0.9994, 1.02478) -- (0.9995, 1.0226) -- (0.9996, 1.02019) -- (0.9997,
1.01747) -- (0.9998, 1.01424) -- (0.9999, 1.01005) -- (0.9999,
1.01005) -- (0.99991, 1.00953) -- (0.99992, 1.00898) -- (0.99993,
1.0084) -- (0.99994, 1.00778) -- (0.99995, 1.0071) -- (0.99996,
1.00634) -- (0.99997, 1.00549) -- (0.99998, 1.00448) -- (0.99999, 1.00317) -- (1,
1) ;
\end{tikzpicture}
\begin{tikzpicture}
\draw[help lines] (0,0) grid (2,2);
\draw[very thick] (0,0) to [out=90,in=195] (2,1.5);
\end{tikzpicture}
\begin{tikzpicture}
\draw[help lines] (0, -0.1) grid (4,1.1);
\draw [<->,thick, cyan] (0,0) to [out=90,in=180] (1,1)
to [out=0,in=180] (2.5,0) to [out=0,in=-135] (4,1) ;
\end{tikzpicture}
\begin{tikzpicture}[xscale=2,yscale=2]
\draw [<->] (0,0.8) -- (0,0) -- (0.5,0);
\draw[green, ultra thick, domain=0:0.5] plot (\x, {0.025+\x+\x*\x});
\end{tikzpicture}
\begin{tikzpicture}[yscale=1.5]
\draw [help lines, <->] (0,0) -- (6.5,0);
\draw [help lines, ->] (0,-1.1) -- (0,1.1);
\draw [green,domain=0:2*pi] plot (\x, {(sin(\x r)* ln(\x+1))/2});
\draw [red,domain=0:pi] plot (\x, {sin(\x r)});
\draw [blue, domain=pi:2*pi] plot (\x, {cos(\x r)*exp(\x/exp(2*pi))});
\end{tikzpicture}
\begin{tikzpicture}[scale=0.5]
\draw [fill=red,ultra thick] (0,0) rectangle (1,1);
\draw [fill=red,ultra thick,red] (2,0) rectangle (3,1);
\draw [blue, fill=blue] (4,0) -- (5,1) -- (4.75,0.15) -- (4,0);
\draw [fill] (7,0.5) circle [radius=0.1];
\draw [fill=orange] (9,0) rectangle (11,1);
\draw [fill=white] (9.25,0.25) rectangle (10,1.5);
\end{tikzpicture}
\begin{tikzpicture}[>=stealth] %see Reference: Arrow Tips in pgfmanual.pdf
\draw [thick, <->] (0,2) -- (0,0) -- (2,0);
\node at (1,1) {yes};
\end{tikzpicture}
\tikz {
\shade [left color=white, right color=red!50] (0,0) rectangle (4,1);
\draw [ultra thick,-{Circle[open]}] (0,4/5) -- ++ (3.5,0);
\draw [ultra thick,-{Triangle[open]}] (0,3/5) -- ++ (3,0);
\draw [ultra thick,-{Triangle[fill=white]}] (0,2/5) -- ++ (3,0);
\draw [ultra thick, -{Arc Barb[reversed] }] (0,1/5) -- ++ (3,0);
\draw [ultra thick, -{Rays[n=9]}] (0,0) -- ++ (2.5,0);
}
\begin{tikzpicture}
\draw [thick, <->] (0,2) -- (0,0) -- (2,0);
\draw[fill] (1,1) circle [radius=0.025];
\node [below] at (1,1) {below};
\node [above] at (1,1) {above};
\node [left] at (1,1) {left};
\node [right] at (1,1) {right};
\end{tikzpicture}
\end{document}
Saturday, December 31, 2016
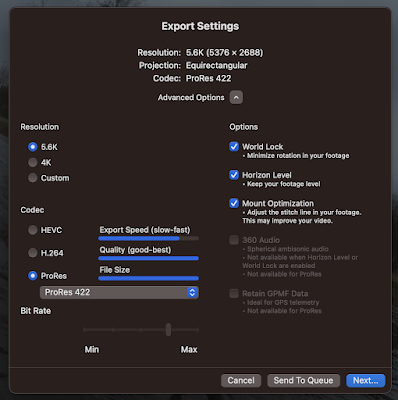
Sharing 360° video?
So, you've got a 360 degree video file from your GoPro. What to do with it? Well, share it on YouTube. YouTube supports uploading and pl...

-
So, you've got a 360 degree video file from your GoPro. What to do with it? Well, share it on YouTube. YouTube supports uploading and pl...
-
(CTAN, a meta-level resource for all things TeX www.ctan.org/ ) Step 1: MacTeX packages for Mac. Install MacTeX, after which do the foll...
-
First, read the article "AI-generated art illustrates another problem with technology" by John Naughton on the Guardian (20 Aug...
