Goal:
Familiarity with Excel graphing functions.
Instructions:
Example in Google docs (link)
Step 1: Enter the sample data
Step 2: Create a stacked bar chart
Step 3: Make the chart look like a Gantt chart
Example in Microsoft Office Excel (link)
Step 1: Enter the sample data
Step 2: Create a stacked bar chart
Step 3: Make the chart look like a Gantt chart
Other links:
Various videos illustrate this process, see this search on google (terms: gantt, excel, video)
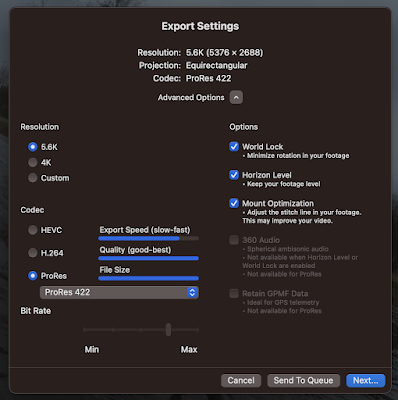
Sharing 360° video?
So, you've got a 360 degree video file from your GoPro. What to do with it? Well, share it on YouTube. YouTube supports uploading and pl...
-
 So, you've got a 360 degree video file from your GoPro. What to do with it? Well, share it on YouTube. YouTube supports uploading and pl...
 -
(CTAN, a meta-level resource for all things TeX www.ctan.org/ ) Step 1: MacTeX packages for Mac. Install MacTeX, after which do the foll...
-
What if "analytics-as-a-service" was an operating model you could plug into your firm's infrastructure? See practicalanalyt...